RF Energy Concepts Sec. 102 Rev. September 20, 2014 ///
Home
Gravity Concepts
Create Momentum
New 2014 Grav. Constants
>
Light Speed vs Special Relativity
Force Interactions
RF Energy Concept
Russian translation of this article by Genchi Info
< RF Energy Concepts <
RF Energy via
Ionosphere
< Demo._RF Energy > RF
Energy Links >
< Prev Pg
Contents
Bottom \/ Next Pg >
Iono. Resonance via Transmitter Graph
Image, US NRL
One of the best demonstrations of the RF electrical power available from the Solar Ionospheric system is shown in the above graph. The graph presents received power vs RF frequency for experiments using ground-based, high-power, high-frequency, transmitters to perturb the ionospheric medium. The highest sharp peak in the graph indicates the 5.456 MHz RF pump energy from the vertically directed antenna and transmitter system. The other three sharp peaks are due to interference signals. The main signal of interest in these curves is the broad shoulder of energy seen to the right of the transmitter peak. It is seen that the band width of the broad shoulder is many times the band width of the perturbing signal (peak). The concept of this paper is to provide a reflecting system on the ground that will allow this broad shoulder of energy to cascade into a stable resonant flow between the ionosphere and a ground based reflector system. Once a resonance (continuous echo) is established, the pump transmitter will not be required; the energy reflected back up to the ionosphere will provide the perturbing radiation for the chain reaction of stimulated emission and constructive interference (entrainment) with the electrical wave energy of the ionosphere.
< Prev Pg Contents Top /\ Bottom \/
Sec. 102
The following is a review of Ionospheric energy research published on the U.S. NRL url http://server5550.itd.nrl.navy.mil/projects/IONO/index.html about their HAARP and SEE projects. Statements of technical interest have been extracted for use here . The complete pages as published with all the general, technical and image material, may be still available at the above URL. The indented paragraphs below are quoted from the NRL site. The interspersed non-indented paragraphs are comments and content by this author. We are indebted to the scientists at NRL for providing this valuable information and the above graph for the public's use.
Quote: Ionospheric Research in Stimulated Electromagnetic Emission (SEE) * NRL
One of the current interest areas in ionospheric research is the production of Stimulated Electromagnetic Emission (SEE) through ionospheric heating. The SEE phenomenon has been observed at various ionospheric modification facilities around the world and has provoked numerous theories concerning its underlying physical mechanism. Although seen at all geomagnetic latitudes, the SEE process appears to be more readily produced in non-aurora regions.
Unquote.
It may be that the SEE process is most readily produced when the Sun is overhead. Any experiments planned for producing a first RF stable resonance should take this possibility into consideration. The proper choice of latitude and season of year may greatly aid the establishment of a first resonance. The lack of the SEE phenomenon in the aurora (pole) regions, mentioned by US NRL above, gives some support to this view.
Quote: A relatively recent technique for studying the dynamics of the ionosphere involves the use of ground-based, high-power, high-frequency, electromagnetic radiation to perturb the ionospheric medium (e.g. HAARP).
<<<<PLEASE NOTE THIS STATEMENT by NRL >>>>>>
The interaction between the high power "pump" wave and the ionospheric plasma results in a complicated transfer of energy from the pump to natural oscillating modes of the medium, which in turn convert a "small fraction" of that energy to electromagnetic waves (stimulated electromagnetic emission or SEE) that is detectable at ground level.
SEE can be broadly subdivided into two groups, up-shifted and down-shifted relative to the pump frequency, that exhibit rather different spectral characteristics.
Unquote.
Only charts of the up-shifted have been found at the NRL site. If anyone is able to provide links to similar charts for the down-shifted side band data it will be interesting and appreciated.
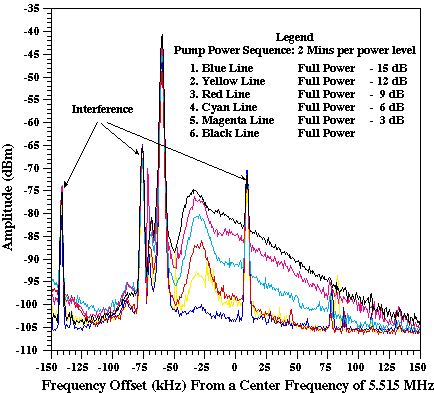
Quote: The dependence of the Broad Up-shifted Maximum SEE (BUM) on pump power is a matter of some interest to an understanding of the interactions involved in its production.
Additional insight into the effect of power stepping on the BUM spectrum (for this pump frequency) is obtained by examining line plots of the BUM at each power level. Each curve in the next figure is the average of all the spectra observed during a two minute period at a given power level.
< Prev Pg Contents Top /\ Bottom \/
Sec. 102
Only curves for the period prior to and during the full power interval are included. They demonstrate a barely visible BUM at -15 dB followed by sharply peaked BUM with a weak shoulder at -12 and -9 dB. The amplitude of the shoulder relative to the main peak increases with further increase in the pump power until the peak and shoulder have almost merged at full power. The resulting spectrum (at full power) rises rapidly to a peak and falls off almost linearly with frequency on the semi-log plot. A possible interpretation for this behavior is that non-linear processes become important at a sufficiently high pump power causing a cascade of energy to shorter wavelengths thereby producing the observed broad spectral shoulder. For sufficiently high pump power an equilibrium condition may be reached characterized by a steady state BUM spectral shape.
An alternative explanation is that there are two independent interactions with different excitation levels. The inner peak is excited at a lower threshold than that of the shoulder. For sufficiently high pump powers, the difference in the interaction thresholds becomes unimportant and the two spectra merge into a single spectrum.
Unquote.
End of NRL Review.
A new and interesting Java animated type demo of the above graph has been added to the web site of the Swedish Institute of Space Physics at the URL http://www.physics.irfu.se/SEE/
Summary of data demonstrating the existence and characteristics of the natural solar-ionospheric radiant energy.
Many applications and configurations of the resonance system are conceivable. Various configurations of reflectors should allow operation in orbit or in the air and on the land or sea. A satellite with a gravity gradient stabilized tether antenna may be able to obtain useful electrical energy with this concept. With a large antenna farm a local aurora may be possible. Ionospheric heating has been reported above large antenna farms for radio stations. The 50 kilowatts as reported by Moray is sufficient to power a small aircraft with no requirements to land for fuel, and of course no fuel load to carry.
< Prev Pg Contents Top /\ Bottom \/
Sec. 102
The following works and articles relate to features of the ionosphere / earth RF resonance as described in this paper.
Ref. # 1
The Royal Society I.G.Y. Expedition
Hally Bay 1955-1959
Vol. II , Plate 9
Ref. # 2
Dr. T. Henry Moray
The Sea of Energy 5th Edition
Mr. John Moray
Puzzling atmospheric bursts spark interest
by R. Monastersky
Science News Feb. 12, 1994 Vol. 145 pg. 100
This Monastersky article reveals that the ALEXIS nuclear detection satellite has detected the RF resonance phenomenon occurring spontaneously. These could have been triggered by lightning strikes or the random RFI bursts normally seen from the cosmos. The ALEXIS bursts reveal a pattern nearly identical to that obtained from radio ionosounding work.
Enigmatic bursts show their true colors
by R. Cowen
Science News Aug. 6, 1994 Vol. 146 pg. 87
This article describes the color photos of the auroras during lightning triggered resonance that are reportedly being studied by Los Alamos Nat. Labs. , Lawrence Livermore Laboratory, Mission Research Corp. of Ft. Collins, Space Sciences Labs in Berkley, NASA. and Stanford University's research staff.
Sun Earth and Radio by J. A. Ratcliff
Further information on the sprite research is available at
the
list of links: Related
Topics RF Energy
Web address URL https://energy-gravity.com/RFenergy_IonoB.htm
Web site by: sbyers11@comcast.net